Cleaning Up My Trash-Filled ELK Dashboard

2026-03-18
There's one improvement I never got around to writing a post about — changing my Nginx configuration.
The reason was simple and clear. About 40–50% of the logs I was checking in Kibana were garbage scanner logs probing non-existent paths like /env, /git, and so on. It was undermining the whole point of having set up the ELK stack in the first place.
So I modified the Nginx config to return 444 for the paths that kept showing up repeatedly in Kibana.
I'll explain later why I chose 444 instead of 404.
(php|php\d?|phtml|wp-admin|wp-content|wp-includes|wp-json|wp-login\.php|xmlrpc\.php|env|git|config|ht|cgi-bin|alfacgiapi|pl|cgi|asp|aspx|jsp|
?:html?|shtml)$ { return 444; } # blacklist example
Of course, the actual configuration wasn't a single block like this — it was split across multiple location blocks.
After that, I saw a positive result: scanner logs dropped from roughly 40–50% to around 20%.
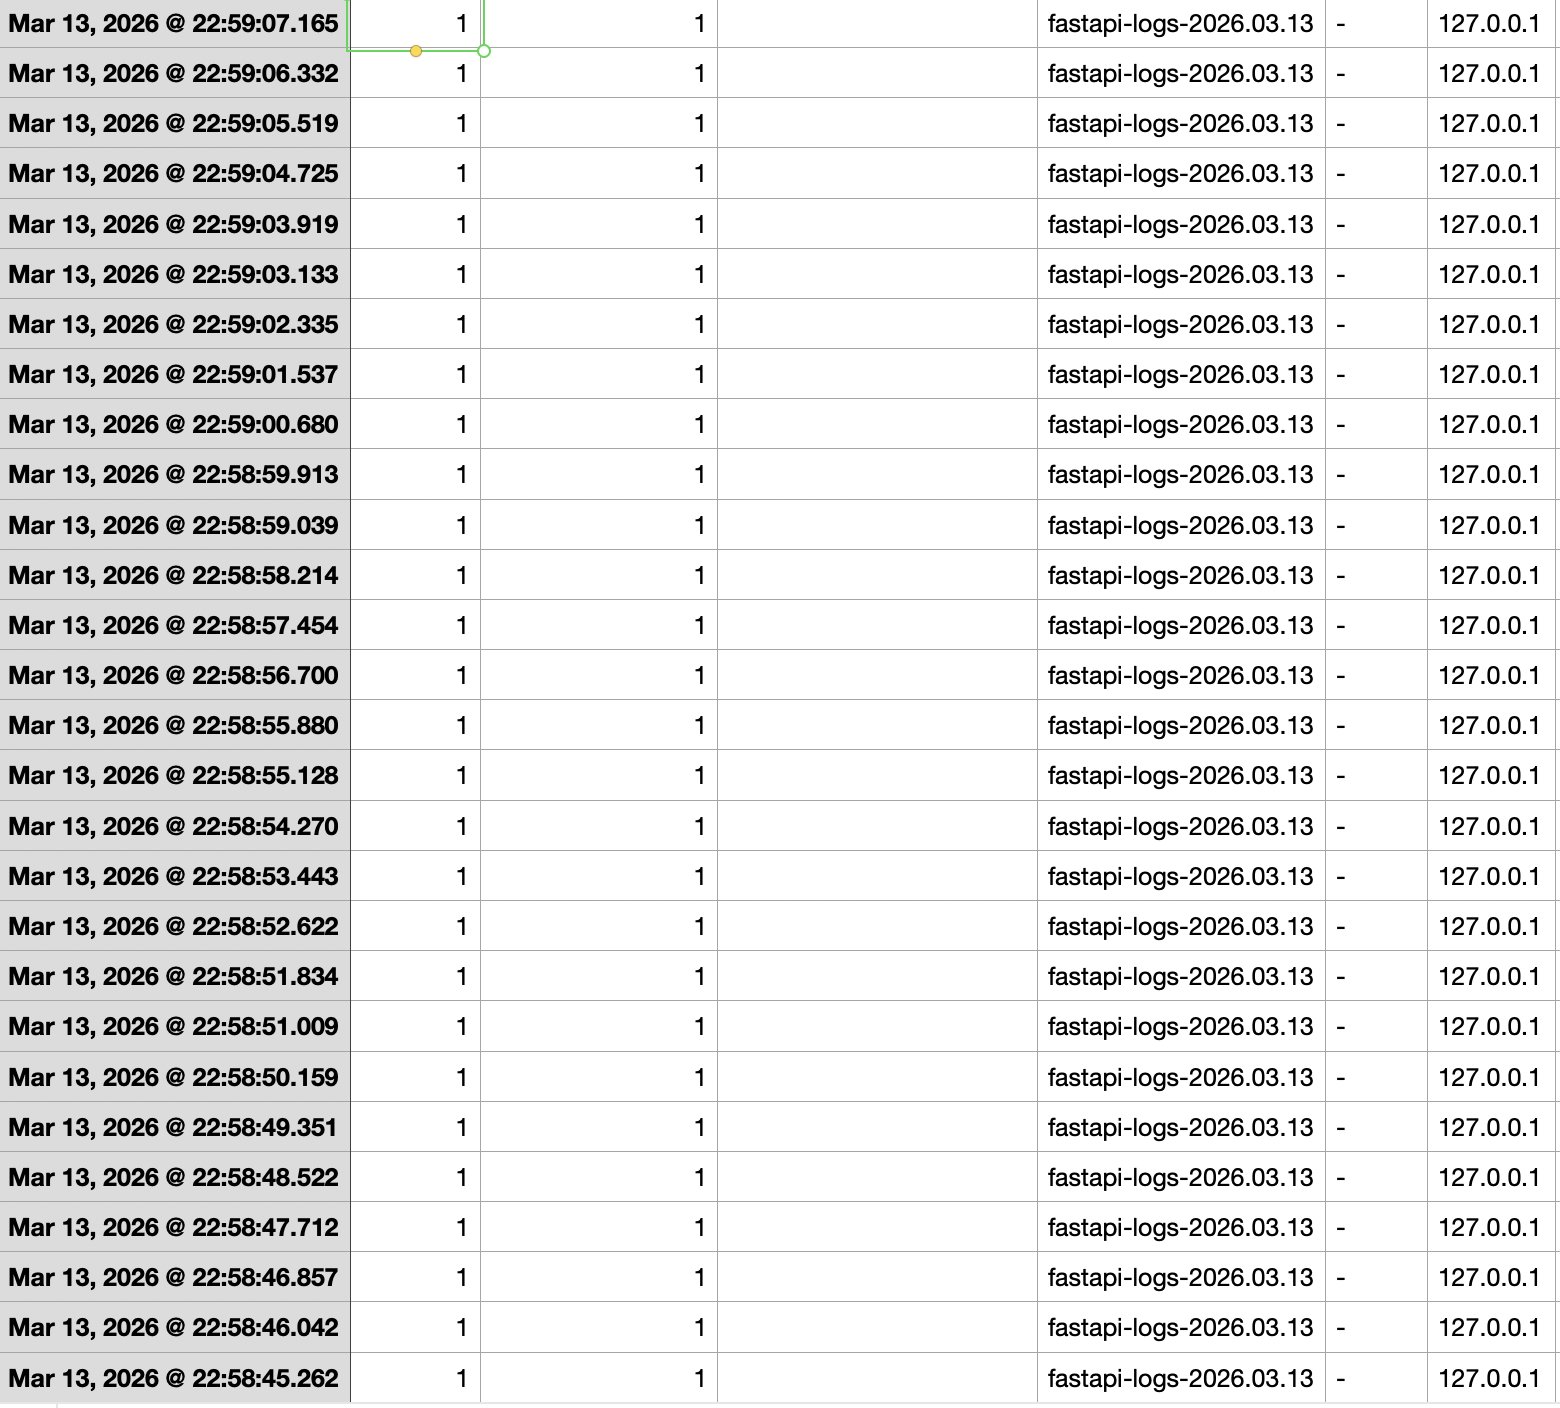
Then yesterday, while casually browsing the Kibana logs, I noticed that 127.0.0.1 had sent 60 POST requests in just 7 seconds — but I hadn't been online at that time. On top of that, I almost never send requests internally, so naturally, I suspected an intrusion.
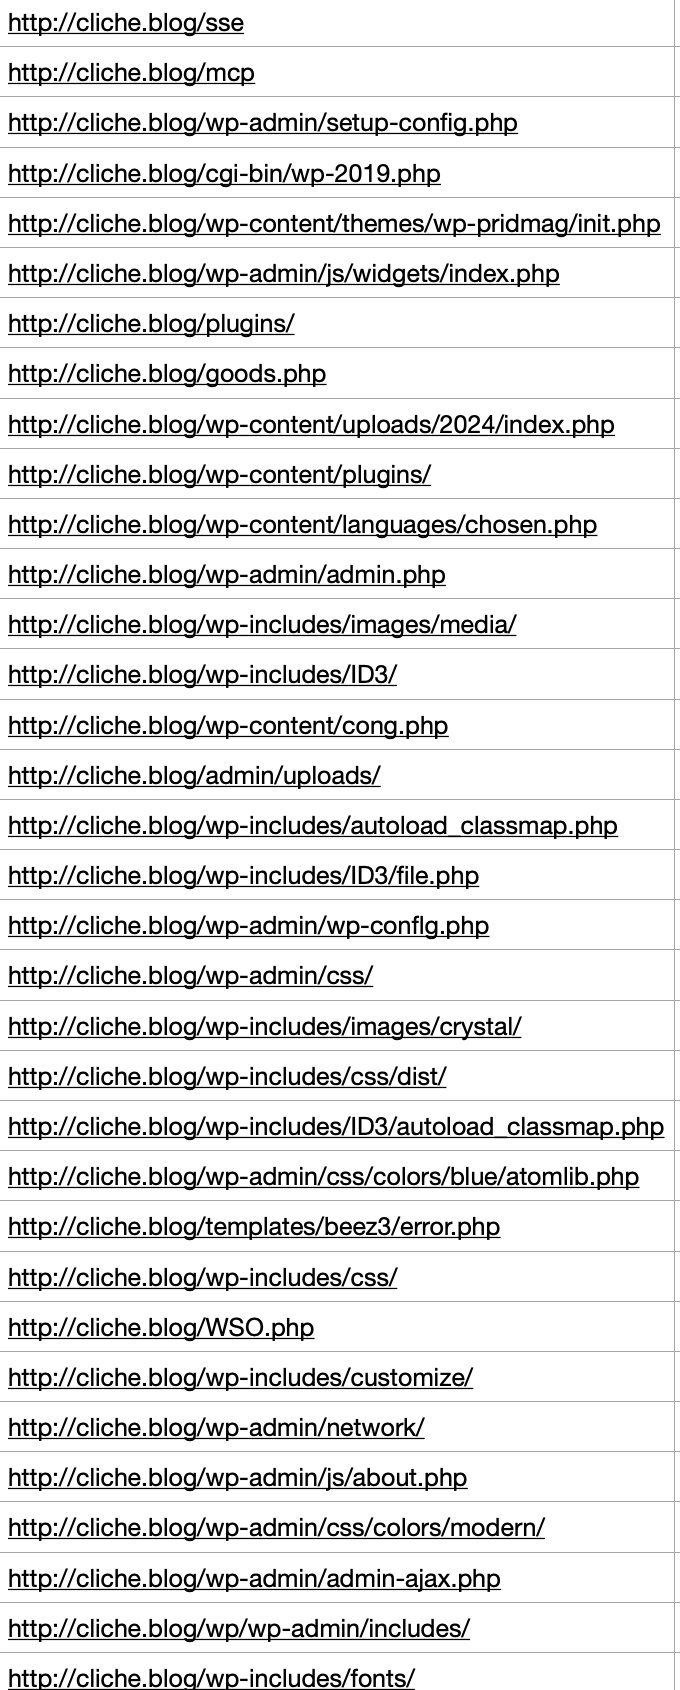
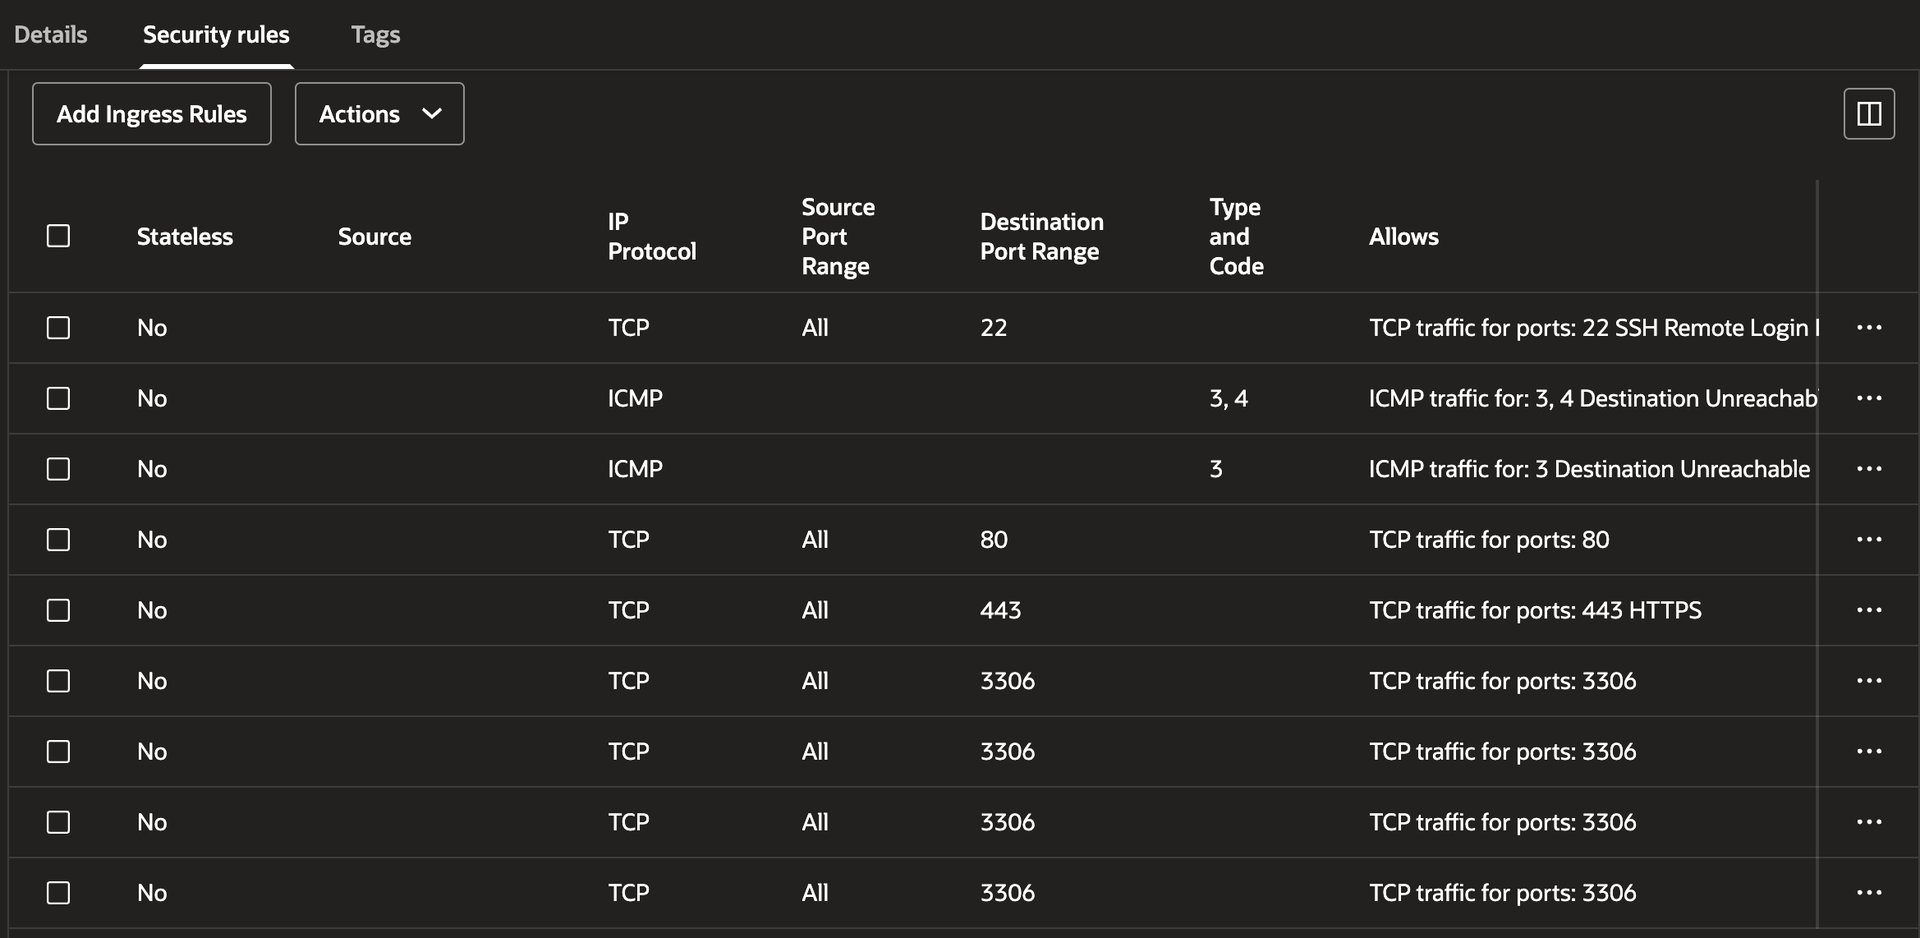
The pattern was also textbook scanning behavior — hitting paths like /api/upwload and /admin/upload. I checked OCI's Security Rules (inbound/outbound) and tried connecting directly to the server at ip:8000 via curl from the terminal, but:
curl: (28) Failed to connect to cliche.blog port 8000 after 134528 ms: Couldn't connect to server
The connection timed out as expected. I also ran the last command to check login history on the instance, and there were no records of anyone — including myself — logging in during that time window. So the internal intrusion hypothesis was ruled out.
Then what the hell was that 127.0.0.1?
When I checked running processes with ps -ef, the most likely suspects were Logstash or Filebeat. But thinking about it more carefully, there's no reason a log collector would be firing POST requests at nonexistent paths like api/upwload — complete with typos.
My head was starting to hurt, so I asked an AI for its opinion.
The Identity Revealed
Then the remaining possibility is most likely OCI's (Oracle Cloud Infrastructure) Vulnerability Scanning service.
My instance had Oracle's Vulnerability Scanning service enabled.
This service doesn't probe from the outside in — it's more like a caretaker (agent) inside the castle, walking around and checking all the locks.
In hindsight, it made sense. 60 requests in 7 seconds is clearly not something a human does manually, and if it were an external intrusion, there'd be login records or at least a crack in OCI's firewall — but both were rock solid. Assuming it was an agent, the puzzle pieces fell into place.
I was still a bit skeptical about the typo-ridden paths, but it turns out that's actually a hallmark of professional security scanners. They automatically test common mistake patterns (fuzzing wordlists) to catch API endpoints accidentally left exposed due to developer typos.
A Backdoor Found by Accident
What almost ended as a harmless episode became the catalyst for overhauling my entire security infrastructure. While tracing potential external attack vectors, I realized my Docker config had the port bound to 0.0.0.0:8000.
It hadn't been an issue so far, but the moment OCI's defenses were to fail for any reason — a misconfiguration, anything — my FastAPI server would be standing buck naked in front of every scanner on the planet.
I immediately locked down the Docker binding.
Changed ports: - "8000:8000" to 127.0.0.1:8000:8000, ensuring external packets couldn't reach the app without going through Nginx first.
Switching the Blocking Strategy
To deal with the remaining 20–30% of bots that kept slipping through via obscure paths, I decided to ditch the blacklist approach entirely and switch to a whitelist.
To put it simply: a blacklist is like a bar that bans you after you cause trouble — you're blocked after the fact. A whitelist is like a members-only club — if you're not on the list, you don't get in. In other words, anything outside my explicitly allowed paths gets rejected. And just like before, the rejection comes in the form of 444 (No Response) rather than 404 (Not Found).
Here's why I chose 444 over 404: when a server returns 404, it means it understood the request but there's no resource at that path. It still generates a full standard response with headers and a body, which means server resources are consumed, and outbound traffic is generated.
With 444, on the other hand — a non-standard Nginx-only response — Nginx checks the whitelist, and the moment it sees an unauthorized path, it simply drops the connection without a word. No HTTP response packet is generated. No transmission. No wasted traffic. Virtually zero load on FastAPI.
If 404 is like answering the phone and saying "sorry, not interested" to a spam call, then 444 is like silencing unknown numbers entirely — the caller has no idea if you're ignoring them or if the line is dead. For bots, they can't tell whether the server is down or the network is flaky, so they end up burning their own retry resources.
Of course, as the immutable truth goes : every technical decision comes with trade-offs, and this approach has its downsides too.
First, there's the operational annoyance. Since any path not explicitly whitelisted gets a 444, every time I add a new route, I have to update the Nginx whitelist and restart it — an extra step in the deployment process.
Second, there's the SEO/UX risk. Not all bots are evil. For every bad bot, there's a good one — namely, search engine crawlers (Google, Naver, etc.). These crawlers try to visit the URLs listed in sitemap.xml one by one. If even a single post URL or static file path is missing from the whitelist regex, the crawler gets a 444 and thinks "this site has links but no actual pages" — and gives up indexing. Since 444 isn't a standard response, bots may also misread it as a "temporary server failure" and come back later, but if this keeps happening, the page's overall ranking inevitably takes a hit. On the UX side, if static assets are missing from the whitelist, resources get blocked and social share previews won't render — tanking credibility.
But in my case, the gains far outweighed the losses. The operational hassle isn't much different from the blacklist approach — I was already manually adding recurring keywords from the logs to location blocks, so adding new routes to a whitelist is roughly the same effort. As for the SEO risk, I serve static assets (images) through external infrastructure (S3) rather than hosting them on the instance, so resource blocking isn't a concern. I also updated sitemap.xml to be dynamically generated via db.query in FastAPI, ensuring all whitelisted routes are publicly discoverable. On top of that, most of my blog traffic comes from acquaintances, my portfolio, GitHub, and LinkedIn rather than organic search — so it made more sense to hard-block bots with 444 and save traffic than to waste resources sending 404 responses.
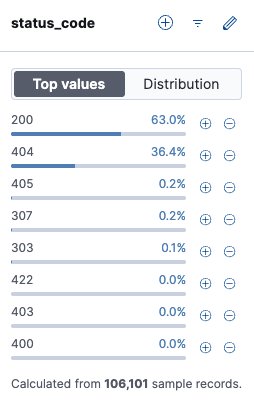
I checked the Kibana logs again. Over the entire period, successful responses (200) accounted for 63%, while error responses (404) made up 36.4%. If this project were a real product with significant MAU instead of a toy project, that's a lot of wasted response processing and outbound traffic. At scale, this kind of waste becomes a cost you can't afford to ignore.
One More Bullet Left
Finally, I added a filter to fail2ban. I set up a system that detects IPs receiving 444 responses from Nginx in real time and permanently bans them at the kernel level.
[nginx-444]
enabled = true
port    = http,https
filter  = nginx-444
logpath = /var/log/nginx/access.log

bantime = 600
bantime.increment = true
bantime.multipliers = 1 3 -1
bantime.maxtime = -1

findtime = 60
maxretry = 11
Above is the final configuration.
Initially, I set findtime to 600 and maxretry to 3, adopting the classic Korean three-strikes-and-you're-out rule to account for innocent bystanders (fellow developers) and human error. But during testing, I discovered that the browsers I tested (Chrome, Safari) appear to interpret a 444 as a network failure and automatically retry the connection. While testing on my phone, I noticed a single access attempt generating 4–5 log entries — which triggered an instant ban. After running unbanip more times than I'd like to admit, I went through a process of trial and error to find the optimal settings that account for browser retry behavior.
Conclusion — and Day One
I've heard it a million times: the ultimate portfolio piece is a service you've actually operated. Honestly, I never deeply agreed with that. With today's AI coding agents — leagues beyond what was available when I started — I'm confident I could rebuild this blog in a fraction of the time with even higher quality.
But then I thought about it again, and everything I've written about in these posts is exactly the kind of stuff AI can't easily teach you. Because at the end of the day, AI is designed to give the safest, most conventional answers. It would recommend a blacklist over a whitelist to avoid the operational and SEO risks. It would suggest standard 404s over non-standard 444s. In other words, today's deep dive also started with a frustration I felt way back when I first built this blog, and if I'd just built it as a portfolio piece and never actually deployed it, I never would have gained these insights.
A terminal-only log setup was too annoying, so I set up ELK. Even with ELK, the relentless scanning wore me down, so I brought in Fail2Ban. And despite all that, bots kept poking every corner, leading to today's overhaul. I wonder what kind of headache will hit me next — and what new insight it'll gift me.
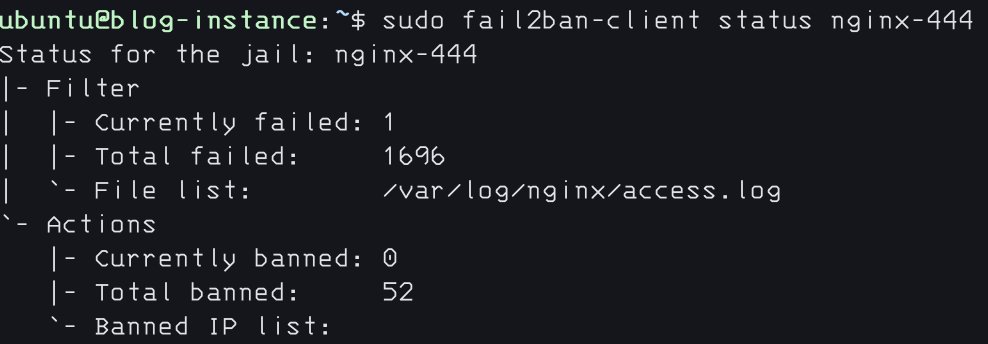
By the way, while I finished the initial draft yesterday, tweaking the details took long enough that I'm only posting it today. In that single day: 1,696 requests received a 444 response, and 52 IPs were banned.
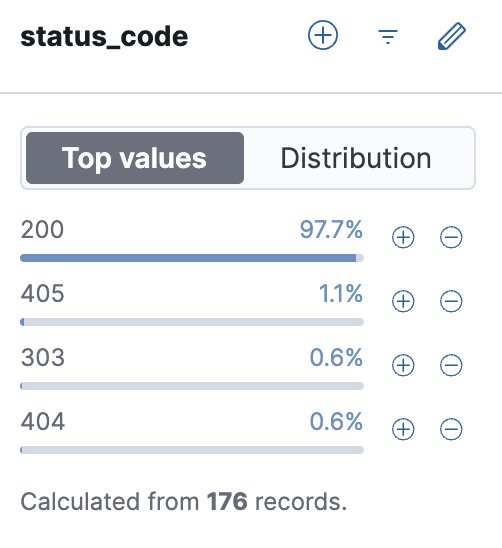
And of course, when filtering Kibana logs by status code, aside from a single 404 from my own testing and a handful of 405s and 303s, 97.7% of all responses are 200.